Technical analysis is a trading methodology that is highly contentious within the trading community. Whether you’re a trader of new or old, you’ve likely heard of technical analysis. Some traders swear by it, many of them writing numerous books on specific indicators or making countless Youtube videos on specific setups that utilize technical analysis. When you’re a new trader looking for ways to predict the market, technical analysis makes sense. I can view a chart with nothing on it, or view the same chart with lines and some indicators on it to help me predict future price action. Surely a chart with more information is better than one without, right?
When I started out trading I was someone who used a lot technical analysis. I tried to learn as many indicators as I could. How they visualized the data, where the data was coming from, what timeframes specific indicators work best on, and more. I read a bunch of books on technical analysis that covered moving averages and other indicators, and I talked to a number of traders that recommended technical analysis. It just seemed like the obvious choice. As time went on though, this started to change.
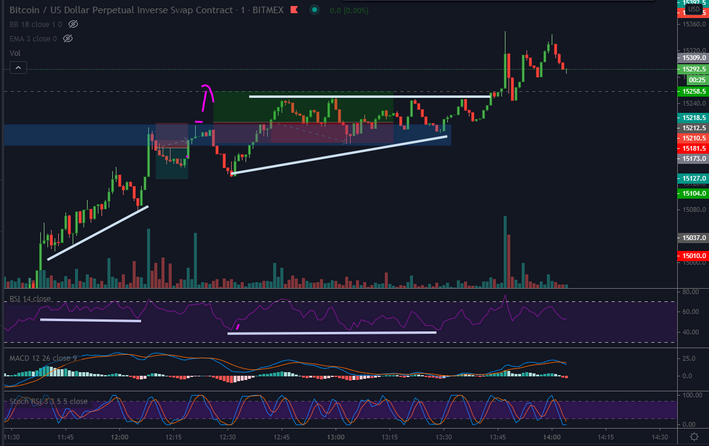
An example of a trade from my earlier years. Yuck.
The later part of my early trading years were spent looking for mentorship. I had been trading for about three years, and I wanted to make sure I was on the right path. I began a search to find profitable, professional traders in hopes of finding some help or mentorship in my journey of becoming a full time trader. I wasn’t looking for swing traders that make some money here and there, I was looking for traders that made their entire living from trading. The search was long and extensive, but I eventually found a few people that met my search criteria. I would ask them questions and post trade setups in hopes of receiving some decent feedback.
In late 2020 I had a discussion with one of those professional trader I sought out previously. He went by the username “Mark” and was in a small, quiet discord. We were discussing risk management and what we use to determine our entries. Earlier in the discussion I had posted a screenshot of a trade I made recently, which included a chart that had a number of indicators on them (I had used these indicators as information to enter and exit my trade with). I highlighted the trade to show how some specific EMA's (exponential moving averages) were important during a downtrend, as they often predicted where the price would go (the price would hug the EMA's as it bounced up).
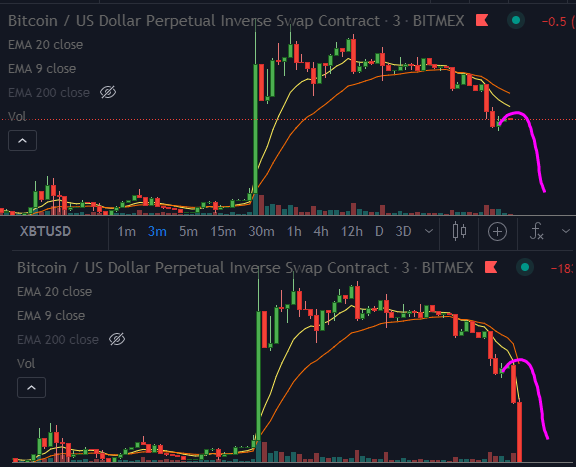
An example of a trade setup using three different EMA’s. This was an attempt to outline how the price would ‘hug’ the EMA’s during a downtrend.
Mark has responded that the information I was using (technical analysis) was simply an illusion and nothing more. It’s not something you want to hear when you’re looking for feedback. Mark was a full time trader who was profitable and only traded for himself. While I wasn’t exactly thrilled with his dismissiveness of the information I had used for years, it lead me to reconsider the information I was using. What if he was right, and all of this was simply a coincidence? Even if technical analysis was simply an illusion, what was his alternative to it?
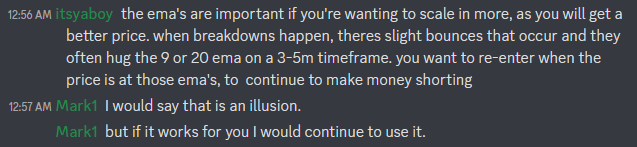
An excerpt of a conversation about technical analysis with another trader.
His dismissiveness of technical analysis led me to begin focusing on other aspects of trading. I started to ask more questions to try and determine what exactly I needed to know. When you ignore technical analysis, what’s left to focus on? Feeling somewhat hopeless, I began to focus on other factors in trading, most of which I never took a deep dive into previously. While Technical analysis can help visualize specific information, you often find yourself trying to find the “perfect combination” of indicators, not take a deeper dive into the data that it uses.
I began to focus on the data that seemed to matter most. This included order flow, volume, trends, support + resistance, and Level 2 data. Level 2 data is combination of time and sales (what was sold, how much, and at what time) and the orderbook (how many limit orders are on the orderbook, and at what price). As I began studying this information on it’s own, a structure had started to form. It was very clear to me that there was a stark difference between trading information and technical analysis. When you begin to focus on real time information (like the data that was provided from the orderbook), you’re focusing on what’s happening in the now. Technical analysis uses information in the past in hopes to predict what will happen in the future. The problem is the past is just that, the past. It sometimes can have a bearing on what will happen in the future, but it may not. If I have a specific strategy that uses technical analysis, is this specific ‘strategy’ backtested, and what is it’s success rate? Even if the success rate is 70%, is that a good enough reason to enter the trade? Am I understanding what technical analysis is showing me, or am I looking for a high success rate strategy that’s easy to follow? If RSI is oversold, am I looking to actually understand why its oversold, or am I simply looking for an excuse to enter or exit a trade? When you’re looking at the level 2 data, you’re looking at what is happening as it’s happening. It became clear to me that this information was a lot more valuable than anything Technical Analysis could have provided me.
I began to focus on traders that specialized in trading this information, and began to avoid traders that used any kind of technical analysis at all. I found commodity and futures traders who provided excellent information and software recommendations. I found scalpers who could articulate and explain their “edge” with full clarity. No weird indicator combinations or some custom build tradingview indicator. Just information related to price action and order flow, and how they approach certain situations. I found traders who didn’t even use charts to enter and exit trades, they just used a Depth of Market platform (a DOM is an orderbook with time and sales information within it). If there’s traders who are profitable without looking at a chart, do I need a chart?
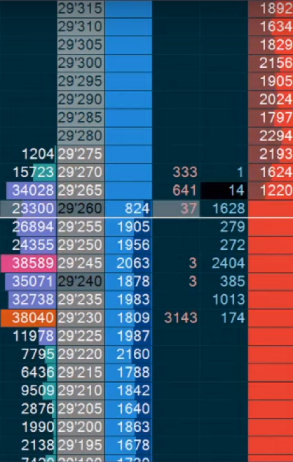
A depth of market (DOM) tool showing what's happening, as it's happening. You won't find this information on a chart.
Every since I began to focus on everything I discussed above, understanding markets and order flow has been a lot easier for me. It helped me get a much better grasp on price action and predicting directional movement better than Technical Analysis ever did. More importantly, I have a better understanding of why certain things happen within markets or price action. As I obtained a better understanding of price action, I began to understand the tremendous difficulty in predicting price within the next five minutes. It became clear to me that predicting the price of something in the next hour was next to impossible, let alone the next day or week.
Since I stopped using Technical Analysis, my trading has improved tremendously. I am very grateful for the advice I received from more experienced traders, as it made me become much more consistently profitable at a much faster rate. I began to understand why price behaved the way it did, what moves the market in a given direction, and how the game was played at a deeper level. In hindsight, technical analysis made me miss the forest for the trees. What moves a market in a given day; large sell orders on the order book, or two EMA's crossing over?
Note: An important aspect of trading is 'what works for you'. If someone trades with technical analysis, and has a profitable system using it, then they should continue to use it. You do not want to stop using a system that brings you consistent results.
Copyright © Pinetrades